Goldman Sachs held on to its position as the top fee-earning investment bank in the year to date, despite losing momentum during a bumper month for new bond, equity and loan deals during March.
Investment banks earned almost as much during the month as they did in January and February combined, with a flurry of new issues generating US$8.95bn of fees for the industry. After a slow start to the year, the global fee pool is 13% down on the same period a year ago.
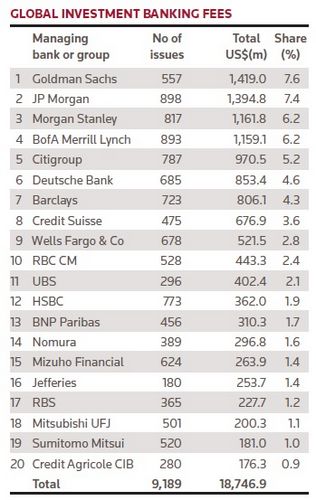
So far this year, Goldman has earned US$1.42bn of the US$18.7bn total pot, having been mandated on 301 issues – far fewer than the rest of the banks in the top seven, illustrating how its higher-paying deals have elevated the firm’s position.
Despite stumbling in the first two months of the year, JP Morgan and Bank of America Merrill Lynch, which dominated the league table for the whole of last year in first and second position respectively, regained their footing and were the only large banks to gain market share in March.
JP Morgan saw its share of the global fee pool rise to 7.4%, up 20 basis points on February. Likewise, BofA Merrill increased its market share to 6.2%, up 30bp on the previous month. Only two other top-10 banks managed to gain market share – Wells Fargo and RBC.
Both JP Morgan and BofA Merrill landed mandates for many of the big bond deals during March. The former was a bookrunner on the US$21bn deal from pharmaceutical company Actavis, in what was the second-biggest bond issue of all time. The latter had a good month in equities too, including being a lead on the US$2bn block sale of Voya Financial. BofA Merrill leads the loans league table.
JP Morgan also managed to knock Goldman Sachs off the top spot in the Americas and in the Europe, Middle East and Africa region. Goldman lost 120bp of market share during March, with its portion falling to 7.6%, after a bumper start to the year for the firm.
Nomura headed the Asia-Pacific league table.
| Global investment banking fees | ||||
|---|---|---|---|---|
| Managing bank or group | No of issues | Total US$(m) | Share (%) | |
| 1 | Goldman Sachs | 557 | 1,419.00 | 7.6 |
| 2 | JP Morgan | 898 | 1,394.80 | 7.4 |
| 3 | Morgan Stanley | 817 | 1,161.80 | 6.2 |
| 4 | BofA Merrill Lynch | 893 | 1,159.10 | 6.2 |
| 5 | Citigroup | 787 | 970.5 | 5.2 |
| 6 | Deutsche Bank | 685 | 853.4 | 4.6 |
| 7 | Barclays | 723 | 806.1 | 4.3 |
| 8 | Credit Suisse | 475 | 676.9 | 3.6 |
| 9 | Wells Fargo & Co | 678 | 521.5 | 2.8 |
| 10 | RBC CM | 528 | 443.3 | 2.4 |
| 11 | UBS | 296 | 402.4 | 2.1 |
| 12 | HSBC | 773 | 362 | 1.9 |
| 13 | BNP Paribas | 456 | 310.3 | 1.7 |
| 14 | Nomura | 389 | 296.8 | 1.6 |
| 15 | Mizuho Financial | 624 | 263.9 | 1.4 |
| 16 | Jefferies | 180 | 253.7 | 1.4 |
| 17 | RBS | 365 | 227.7 | 1.2 |
| 18 | Mitsubishi UFJ | 501 | 200.3 | 1.1 |
| 19 | Sumitomo Mitsui | 520 | 181 | 1 |
| 20 | Credit Agricole CIB | 280 | 176.3 | 0.9 |
| | Total | 9,189 | 18,746.90 | |
| Americas investment banking | ||||
|---|---|---|---|---|
| Managing bank or group | No of issues | Total US$(m) | Share (%) | |
| 1 | JP Morgan | 610 | 1,001.60 | 9.1 |
| 2 | Goldman Sachs | 304 | 955.9 | 8.7 |
| 3 | BofA Merrill Lynch | 638 | 893.5 | 8.1 |
| 4 | Morgan Stanley | 459 | 851.3 | 7.8 |
| 5 | Citigroup | 480 | 670.1 | 6.1 |
| 6 | Barclays | 415 | 565.4 | 5.1 |
| 7 | Wells Fargo & Co | 638 | 488.3 | 4.4 |
| 8 | Deutsche Bank | 325 | 476.9 | 4.3 |
| 9 | Credit Suisse | 270 | 434 | 4 |
| 10 | RBC CM | 423 | 379.9 | 3.5 |
| | Total | 4,271 | 10,984.50 | |
| Asia-Pacific & Japan investment banking | ||||
|---|---|---|---|---|
| Managing bank or group | No of issues | Total US$(m) | Share (%) | |
| 1 | Nomura | 211 | 183.1 | 5.9 |
| 2 | Goldman Sachs | 120 | 151.5 | 4.9 |
| 3 | Mizuho Financial | 426 | 127.8 | 4.1 |
| 4 | Morgan Stanley | 229 | 123.7 | 4 |
| 5 | Sumitomo Mitsui | 373 | 120.6 | 3.9 |
| 6 | CITIC | 54 | 108.2 | 3.5 |
| 7 | UBS | 68 | 103.1 | 3.3 |
| 8 | Deutsche Bank | 112 | 78.5 | 2.5 |
| 9 | Citigroup | 116 | 77.6 | 2.5 |
| 10 | JP Morgan | 71 | 73.4 | 2.4 |
| | Total | 2,795 | 3,110.70 | |
| EMEA investment banking | ||||
|---|---|---|---|---|
| Managing bank or group | No of issues | Total US$(m) | Share (%) | |
| 1 | JP Morgan | 218 | 319.8 | 6.9 |
| 2 | Goldman Sachs | 133 | 311.5 | 6.7 |
| 3 | Deutsche Bank | 248 | 298 | 6.4 |
| 4 | Citigroup | 192 | 222.8 | 4.8 |
| 5 | Barclays | 212 | 197.8 | 4.3 |
| 6 | BofA Merrill Lynch | 148 | 196.6 | 4.2 |
| 7 | BNP Paribas | 214 | 190.7 | 4.1 |
| 8 | Morgan Stanley | 129 | 186.8 | 4 |
| 9 | Credit Suisse | 135 | 175 | 3.8 |
| 10 | HSBC | 255 | 172.7 | 3.7 |
| | Total | 2,214 | 4,651.60 | |
| Global bonds | ||||
|---|---|---|---|---|
| Managing bank or group | No of issues | Total US$(m) | Share (%) | |
| 1 | JP Morgan | 491 | 472.6 | 7.8 |
| 2 | Citigroup | 492 | 434 | 7.2 |
| 3 | Morgan Stanley | 559 | 418.5 | 6.9 |
| 4 | BofA Merrill Lynch | 429 | 377.3 | 6.3 |
| 5 | Deutsche Bank | 481 | 369.9 | 6.1 |
| 6 | Barclays | 467 | 339.4 | 5.6 |
| 7 | Credit Suisse | 300 | 300.4 | 5 |
| 8 | Goldman Sachs | 340 | 285.2 | 4.7 |
| 9 | Wells Fargo & Co | 372 | 223.5 | 3.7 |
| 10 | HSBC | 555 | 210.7 | 3.5 |
| | Total | 4,811 | 6,030.00 | |
| Global equities | ||||
|---|---|---|---|---|
| Managing bank or group | No of issues | Total US$(m) | Share (%) | |
| 1 | JP Morgan | 113 | 378.8 | 7.7 |
| 2 | Morgan Stanley | 127 | 286.7 | 5.8 |
| 3 | BofA Merrill Lynch | 103 | 284.3 | 5.8 |
| 4 | Goldman Sachs | 83 | 265.4 | 5.4 |
| 5 | Deutsche Bank | 65 | 194.4 | 4 |
| 6 | UBS | 67 | 185.5 | 3.8 |
| 7 | Citigroup | 75 | 176.8 | 3.6 |
| 8 | Credit Suisse | 70 | 167.6 | 3.4 |
| 9 | Barclays | 67 | 161.5 | 3.3 |
| 10 | RBC CM | 83 | 129.7 | 2.6 |
| | Total | 1,263 | 4,901.60 | |
| Global loans | ||||
|---|---|---|---|---|
| Managing bank or group | No of issues | Total US$(m) | Share (%) | |
| 1 | BofA Merrill Lynch | 317 | 191.6 | 7.1 |
| 2 | JP Morgan | 241 | 167.4 | 6.2 |
| 3 | Wells Fargo & Co | 239 | 135.7 | 5 |
| 4 | Barclays | 148 | 126.9 | 4.7 |
| 5 | Citigroup | 170 | 122.2 | 4.5 |
| 6 | Deutsche Bank | 103 | 107.5 | 4 |
| 7 | Mitsubishi UFJ | 283 | 95.7 | 3.6 |
| 8 | RBC CM | 96 | 93.6 | 3.5 |
| 9 | Goldman Sachs | 62 | 92.3 | 3.4 |
| 10 | Credit Suisse | 68 | 79.8 | 3 |
| | Total | 1,603 | 2,694.70 | |