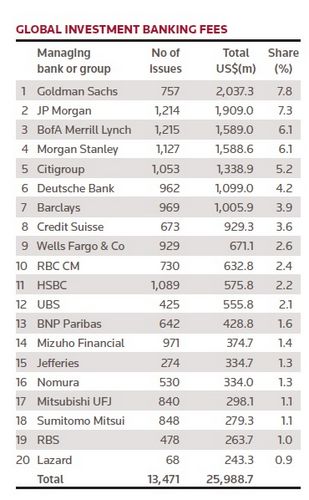
Goldman Sachs continued to hold off JP Morgan as the top investment bank around the globe in the first four months of the year, based on combined fees from advisory, bonds, equity and loans.
But where Goldman continued to excel was in advisory – posting its strongest run since the last M&A peak in 2007. More than half of Goldman’s US$2bn in fees in the four-month period came from advisory. Goldman was also the only bank in the top ten to actually boost fee revenue compared with the year earlier quarter, according to Thomson Reuters data.
Bank of America Merrill Lynch, Morgan Stanley and Citigroup rounded out the top five, followed by Deutsche Bank and Barclays, which moved ahead of Credit Suisse.
In EMEA, Goldman and JP Morgan slugged it out, with Goldman besting JP Morgan narrowly based on fees. While JP Morgan and Deutsche Bank both worked on more EMEA deals, 297 and 342 respectively, Goldman was able to out-earn them both with just 184 deals.
Citigroup and Morgan Stanley made up the other top five, with Barclays still just outside in sixth place.
JP Morgan was the top investment bank in the Americas through to April, but barely. The bank took a 9% market share with US$1.3bn in fees, just US$10m more than Goldman. JP Morgan’s roster included 821 deals, however, compared with 418 for Goldman. BofA Merrill Lynch ranked third with US$1.2bn in fees on 855 deals.
In Asia, Goldman was also on top, although its deal roster included a quarter of the 694 deals that propelled Mizuho Financial into the number two spot. Nomura and Sumitomo Mitsui were third and fourth respectively, with Morgan Stanley rounding out the top five.
In bonds, JP Morgan was on top with an 8.5% share of the market followed by BofA Merrill. In loans, BofA took the top spot with US$258m in fees and a 6.8% market share. JP Morgan followed with 6.3%. Wells Fargo, Citi and Mitsubishi UFJ rounded the top five, with Barclays and Deutsche just outside.
In equity underwriting fees, Goldman edged past JP Morgan, taking a 6.9% share compared with 6.7%. Last month, Goldman was fourth. Morgan Stanley, BofA Merrill Lynch and Citi were the others in the top five.
| Global Investment Banking Fees: April 2015 | ||||
|---|---|---|---|---|
| Managing bank or group | No of issues | Total US$(m) | Share (%) | |
| 1 | Goldman Sachs | 757 | 2,037.30 | 7.8 |
| 2 | JP Morgan | 1,214 | 1,909.00 | 7.3 |
| 3 | BofA Merrill Lynch | 1,215 | 1,589.00 | 6.1 |
| 4 | Morgan Stanley | 1,127 | 1,588.60 | 6.1 |
| 5 | Citigroup | 1,053 | 1,338.90 | 5.2 |
| 6 | Deutsche Bank | 962 | 1,099.00 | 4.2 |
| 7 | Barclays | 969 | 1,005.90 | 3.9 |
| 8 | Credit Suisse | 673 | 929.3 | 3.6 |
| 9 | Wells Fargo & Co | 929 | 671.1 | 2.6 |
| 10 | RBC CM | 730 | 632.8 | 2.4 |
| 11 | HSBC | 1,089 | 575.8 | 2.2 |
| 12 | UBS | 425 | 555.8 | 2.1 |
| 13 | BNP Paribas | 642 | 428.8 | 1.6 |
| 14 | Mizuho Financial | 971 | 374.7 | 1.4 |
| 15 | Jefferies | 274 | 334.7 | 1.3 |
| 16 | Nomura | 530 | 334 | 1.3 |
| 17 | Mitsubishi UFJ | 840 | 298.1 | 1.1 |
| 18 | Sumitomo Mitsui | 848 | 279.3 | 1.1 |
| 19 | RBS | 478 | 263.7 | 1 |
| 20 | Lazard | 68 | 243.3 | 0.9 |
| | Total | 13,471 | 25,988.70 | |
| Americas Investment Banking: April 2015 | ||||
|---|---|---|---|---|
| Managing bank or group | No of issues | Total US$(m) | Share (%) | |
| 1 | JP Morgan | 821 | 1,307.50 | 9 |
| 2 | Goldman Sachs | 418 | 1,306.50 | 8.9 |
| 3 | BofA Merrill Lynch | 855 | 1,197.20 | 8.2 |
| 4 | Morgan Stanley | 635 | 1,100.90 | 7.5 |
| 5 | Citigroup | 633 | 900.8 | 6.2 |
| 6 | Barclays | 538 | 660.2 | 4.5 |
| 7 | Wells Fargo & Co | 879 | 633 | 4.3 |
| 8 | Credit Suisse | 387 | 611.2 | 4.2 |
| 9 | Deutsche Bank | 463 | 610 | 4.2 |
| 10 | RBC CM | 571 | 529.7 | 3.6 |
| | Total | 6,144 | 14,599.80 | |
| Asia-Pacific & Japan Investment Banking: April 2015 | ||||
|---|---|---|---|---|
| Managing bank or group | No of issues | Total US$(m) | Share (%) | |
| 1 | Goldman Sachs | 155 | 267.3 | 6 |
| 2 | Mizuho Financial | 694 | 196 | 4.4 |
| 3 | Nomura | 289 | 195.6 | 4.4 |
| 4 | Sumitomo Mitsui | 644 | 195.3 | 4.4 |
| 5 | Morgan Stanley | 320 | 185.7 | 4.2 |
| 6 | JP Morgan | 98 | 143.9 | 3.2 |
| 7 | UBS | 98 | 141.2 | 3.2 |
| 8 | CITIC | 72 | 138 | 3.1 |
| 9 | Citigroup | 149 | 125.5 | 2.8 |
| 10 | Deutsche Bank | 157 | 107.4 | 2.4 |
| | Total | 4,233 | 4,450.20 | |
| EMEA Investment Banking: April 2015 | ||||
|---|---|---|---|---|
| Managing bank or group | No of issues | Total US$(m) | Share (%) | |
| 1 | Goldman Sachs | 184 | 463.6 | 6.7 |
| 2 | JP Morgan | 297 | 457.7 | 6.6 |
| 3 | Deutsche Bank | 342 | 381.7 | 5.5 |
| 4 | Citigroup | 272 | 312.6 | 4.5 |
| 5 | Morgan Stanley | 173 | 302 | 4.4 |
| 6 | Barclays | 309 | 299.4 | 4.3 |
| 7 | HSBC | 393 | 294.2 | 4.2 |
| 8 | BofA Merrill Lynch | 213 | 291 | 4.2 |
| 9 | BNP Paribas | 329 | 276 | 4 |
| 10 | Credit Suisse | 199 | 235.4 | 3.4 |
| | Total | 3,223 | 6,938.70 | |
| Global Bonds: April 2015 | ||||
|---|---|---|---|---|
| Managing bank or group | No of issues | Total US$(m) | Share (%) | |
| 1 | JP Morgan | 655 | 672.9 | 8.5 |
| 2 | BofA Merrill Lynch | 604 | 566.8 | 7.2 |
| 3 | Citigroup | 648 | 547.5 | 6.9 |
| 4 | Morgan Stanley | 776 | 484 | 6.1 |
| 5 | Deutsche Bank | 672 | 469.2 | 5.9 |
| 6 | Barclays | 620 | 431.7 | 5.5 |
| 7 | Credit Suisse | 433 | 404.1 | 5.1 |
| 8 | Goldman Sachs | 449 | 393.5 | 5 |
| 9 | HSBC | 769 | 301.9 | 3.8 |
| 10 | Wells Fargo & Co | 537 | 292 | 3.7 |
| | Total | 6,825 | 7,909.4 | |
| Global Equities: April 2015 | ||||
|---|---|---|---|---|
| Managing bank or group | No of issues | Total US$(m) | Share (%) | |
| 1 | Goldman Sachs | 118 | 485 | 6.9 |
| 2 | JP Morgan | 157 | 472.8 | 6.7 |
| 3 | Morgan Stanley | 181 | 446.7 | 6.4 |
| 4 | BofA Merrill Lynch | 133 | 358.5 | 5.1 |
| 5 | Citigroup | 107 | 290.6 | 4.1 |
| 6 | Deutsche Bank | 91 | 244.3 | 3.5 |
| 7 | UBS | 103 | 238.4 | 3.4 |
| 8 | Credit Suisse | 99 | 228.3 | 3.3 |
| 9 | Barclays | 91 | 192.8 | 2.8 |
| 10 | RBC CM | 120 | 176 | 2.5 |
| | Total | 1,828 | 7,008.60 | |
| Global Loans: April 2015 | ||||
|---|---|---|---|---|
| Managing bank or group | No of issues | Total US$(m) | Share (%) | |
| 1 | BofA Merrill Lynch | 414 | 258.5 | 6.8 |
| 2 | JP Morgan | 328 | 239.3 | 6.3 |
| 3 | Wells Fargo & Co | 306 | 167.3 | 4.4 |
| 4 | Mitsubishi UFJ | 564 | 160.5 | 4.2 |
| 5 | Citigroup | 227 | 155.6 | 4.1 |
| 6 | Barclays | 204 | 153.1 | 4 |
| 7 | Deutsche Bank | 152 | 147.3 | 3.9 |
| 8 | Goldman Sachs | 84 | 124.5 | 3.3 |
| 9 | HSBC | 253 | 124 | 3.3 |
| 10 | Mizuho Financial | 415 | 119.7 | 3.2 |
| | Total | 2,638 | 3,795.80 | |