Global investment banking fees are expected to drop 10% in 2012. But that number flatters the reality experienced by a number of market participants. To many, the year felt a lot worse than that.
To see the full digital edition of the IFR Review of the Year, please <a onclick="window.open(this.href);return false;" onkeypress="window.open(this.href);return false;" href="http://edition.pagesuite-professional.co.uk//launch.aspx?eid=24f9e7f4-9d79-4e69-a475-1a3b43fb8580">click here</a>.
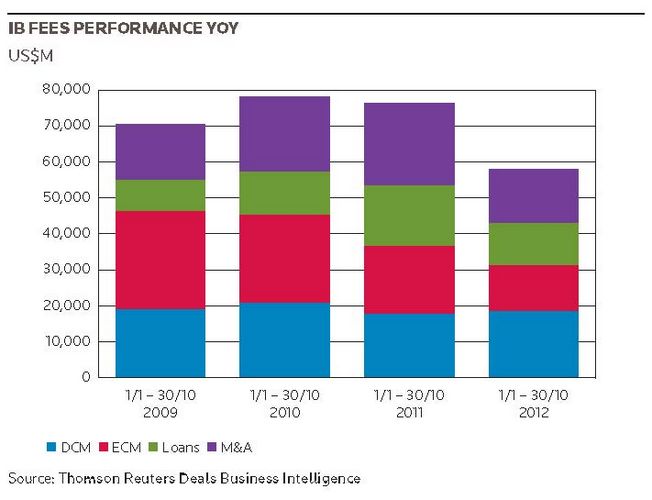
Investment banking fees across M&A, equity and debt underwriting and loan syndications are on track to decline almost 10% in 2012 – to probably less than US$70bn, based on Thomson Reuters Deals Business Intelligence data for the first 10 months of the year.
The devil is in the detail, though, and the individual product breakdowns reveal more mixed fortunes. Activity in ECM and M&A in particular tends to be correlated with general confidence, which was deflated in 2012. ECM fees will likely see a 20%-plus year-on-year slump to around US$15bn (a 44% slump relative to 2009 totals), while M&A fees could see a decline of more than a quarter over full-year 2011 levels to US$18bn.
And because the lending model has been altered by the unfinished cycle of bank deleveraging, strategic realignments, a rethinking of the relationship banking model and general economic misery, 2012 syndicated lending fees look likely to fall by 20% to the US$14bn level.
The only saving grace in the past year’s fee data was DCM. A wave of liquidity was unleashed by almost perfect technical conditions (government bond yields close to zero). Sustained quantitative easing and other forms of monetary stimulus by central banks in the US, eurozone, Japan, UK, China and elsewhere led to a surge of new bond issuance. Institutional investors craved positive inflation-adjusted yields and aggressively sought it in credit. Annual DCM fees look like they’re on for a rise of 20% to around US$22bn.
The bond market clearly also benefited from the disintermediation trade, as issuers arbitraged between loans and bonds as a direct corollary of bank deleveraging and better technicals, and invariably found they could achieve better execution in the bond market.
Investment banks self-evidently depend for their existence on fees and commissions. While financing businesses and M&A only tell part of the overall fee story, FICC trading revenues – the mainstay of investment bank revenues for years – have been in a funk for some time. While there were signs of improvement in some of the third-quarter bank earnings in this product line, it is too early to call a turn in the fortunes of FICC. All in all, 2012 was a tough year for parts of the capital markets and for event-driven activity, as the broad environment was buffeted by a range of political, geopolitical, macroeconomic and financial sector woes.
Contending with uncertainties
The Greek debt workout was still on the negotiating table in November, while there was still uncertainty as to whether Spain would request a formal EU bailout. As if the continuing eurozone crisis were not enough, market professionals also had to contend with the so-called fiscal cliff following the US presidential election, the escalating row between Israel and Iran, civil war in Syria, economic deceleration in China and other key emerging markets, and recession in areas of the developed world.
Those issues did a good job of derailing the investment banking fee-generation environment. Beyond those themes, internal financial sector issues around tighter regulation, higher capital requirements, wholesale/retail ring-fencing, corporate governance failures, market capacity issues, strategic rethinking and headcount reductions created a heady and volatile mix that undermined best efforts.
Where businesses contracted due to the general environment, however, it did not mean that banks were idle. “The things that investment banks do are not going away; they just need a good injection of confidence,” said Tom King, deputy CEO of the investment banking division at Barclays. “For businesses we think are going to do well, we focused on building backlog and positioning for the next part of the cycle.”
“In an environment like this, we have more flexibility to staff our strategic assignments with senior bankers,” he said, pointing out that in 2012 the firm focused on pieces of the wallet that travel well with volatility, such as investment-grade loans and DCM, corporate broking, FIG and associated risk-management products.
US on top
From a regional perspective, the US has consistently picked up global market share over the past four years and looks set to capture around 57% of the IB business on offer in 2012, a full 11 percentage point uplift from 2009, with 2012 fees likely to be above US$39bn for the full year.
That increase in wallet share has come almost exclusively at the expense of Europe (down to 24% share in 2012) as the fortunes of the dollar market contrasted sharply with those of its euro counterpart. Asia-Pacific will likely come in at around 19% of wallet in full-year 2012, the same as in 2011 and actually down from almost 24% in 2010. Asia continued to punch above its weight in terms of rhetoric and expectation versus the realities of deal flow.
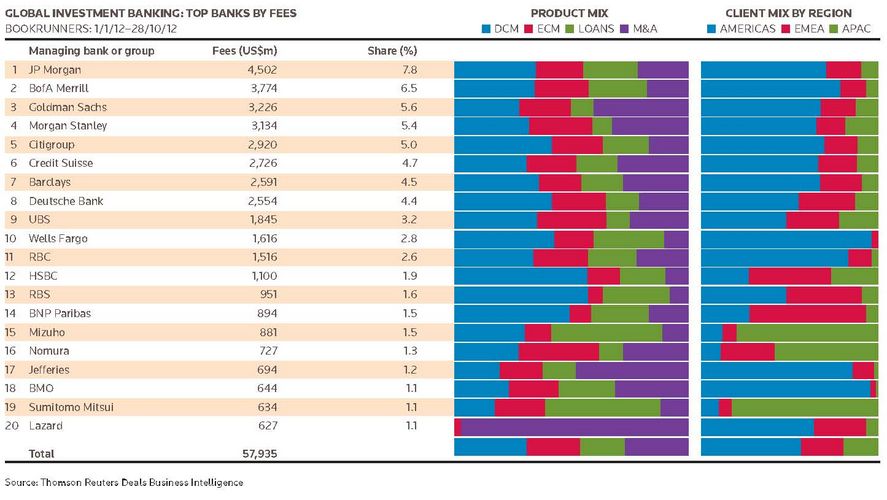
On an individual firm basis, the 2012 fee numbers are unremarkable. JP Morgan looks likely to retain its top ranking across DCM, ECM and lending in 2012; the firm was third in M&A as of the end of October, but retains its number one overall IB fee position. Bank of America Merrill Lynch ranked second overall at the end of October (second in DCM, ECM and loans; sixth in M&A). As a testament to the earnings power of M&A, Goldman Sachs ranked third overall thanks to its number one position in M&A advisory, which enabled it to trump competitors despite coming in 12th in loans, seventh in DCM, and fourth in ECM.
Wells Fargo surprises
The only real surprise in the global top 10 was perhaps Wells Fargo, which came in 10th with a pretty good distribution across products (DCM accounted for 43% of its wallet; loans 30%). The fact that 97% of that wallet was generated in the US is not a surprise, though it does speak to the dynamic earnings power of the US capital market.
In year-on-year performance, the fee data reveal very little change in the global bulge-bracket. The top 10 have been in pretty much the same positions for four years, with either one move up or down. On a 2009–12 trajectory play, though, Barclays has been a consistent riser, jumping from ninth in 2009 to seventh in the first 10 months of 2012. Other notable top 20 performers were Wells Fargo (14th to 10th), RBC Capital Markets (15th to 11th), Mizuho (19th to 15th), Jefferies (32nd to 17th), BMO Capital Markets (28th to 18th) and SMBC (31st to 19th).
Sense-checking
In terms of how investment banking industry stratification plays out, though, 2012 offered some interesting developments. The much vaunted shake-out of bulge-bracket wannabes was much talked about but only really started to emerge in November, when UBS made its decision to shutter large parts of its debt trading business. That decision threw the entire industry into a quandary as firms sense-checked it against themselves.
The days when a couple of dozen investment banks laid claim to being global players competing at the top table are well and truly over. The long-term impact of restructuring and re-strategising initiatives on size and distribution of the IB wallet will not become clear for at least three years, but in general investment banks are developing more tailored strategies.
“Going forward, you’re going to have six banks competing for global capital and advisory flows; everyone else will be relegated to a niche position. Those firms will be Bank of America Merrill Lynch, Barclays, Citigroup, Deutsche Bank, Goldman Sachs and JP Morgan,” said a senior industry figure who did not want to be named in discussing competitors.
His comments echoed those made by Deutsche Bank CFO Stefan Krause, who spoke on the firm’s third-quarter earnings call of a bar-belling of the landscape, where business would flow to a slimmed-down bulge-bracket and mid-tier firms would find it difficult to achieve adequate returns.
Barclays’ King emphasised that while business focus might change depending on the environment, success in investment banking is about long-term commitment. “We’re not building our business for one part of one cycle. We’re trying to get ourselves positioned for the next decade. But we’re also trying to build businesses that are of a size that can break even in the worst part of the market,” King said.
“You don’t need a very different footprint of senior bankers from the bottom of the cycle to the top of the cycle. If you put a cadre of bankers together at the bottom of the cycle, where you know roughly what share you can get and what fees are going to look like, and if you structure a business to break even at the bottom of the cycle, you’ll enjoy operating leverage as the cycle changes.”
| Global IB Fees – Americas Bookrunners: 1/1/2012 to 28/10/2012 | ||
|---|---|---|
| Managing bank or group | Fees (US$m) | |
| 1 | JP Morgan | 3,181.53 |
| 2 | BofA Merrill | 2,962.62 |
| 3 | Goldman Sachs | 2,184.03 |
| 4 | Citigroup | 2,058.12 |
| 5 | Morgan Stanley | 2,051.93 |
| 6 | Credit Suisse | 1,815.46 |
| 7 | Barclays | 1,751.62 |
| 8 | Wells Fargo | 1,565.76 |
| 9 | Deutsche Bank | 1,407.50 |
| 10 | RBC | 1,259.91 |
| 11 | UBS | 889.53 |
| 12 | BMO | 615.88 |
| 13 | Jefferies | 592.33 |
| 14 | RBS | 463.72 |
| 15 | Lazard | 396.54 |
| 16 | Scotiabank | 395.67 |
| 17 | TD Securities | 378.58 |
| 18 | HSBC | 300.35 |
| 19 | Mitsubishi UFJ | 253.73 |
| 20 | BNP Paribas | 248.56 |
| Top 20 Total | 24,773.38 | |
| Regional total | 32,781.43 | |
| Source: Thomson Reuters Deals Business Intelligence | ||
| Global IB Fees – EMEA Bookrunners: 1/1/2012 to 28/10/2012 | ||
|---|---|---|
| Managing bank or group | Fees (US$m) | |
| 1 | JP Morgan | 900.79 |
| 2 | Deutsche Bank | 830.63 |
| 3 | Goldman Sachs | 642.62 |
| 4 | Barclays | 610.26 |
| 5 | BNP Paribas | 585.27 |
| 6 | Credit Suisse | 579.94 |
| 7 | BofA Merrill | 564.65 |
| 8 | UBS | 547.52 |
| 9 | Citigroup | 536.56 |
| 10 | HSBC | 509.73 |
| 11 | Morgan Stanley | 489.53 |
| 12 | RBS | 400.18 |
| 13 | Societe Generale | 349.35 |
| 14 | Credit Agricole CIB | 264.13 |
| 15 | Nomura | 219.8 |
| 16 | RBC | 203.95 |
| 17 | Lazard | 190.73 |
| 18 | Mitsubishi UFJ | 95.95 |
| 19 | Jefferies | 86.22 |
| 20 | TD Securities | 83.52 |
| Top 20 Total | 8,691.33 | |
| Regional total | 14,109.68 | |
| Source: Thomson Reuters Deals Business Intelligence | ||
| Global IB Fees – ASia-Pacific Bookrunners: 1/1/2012 to 28/10/2012 | ||
|---|---|---|
| Managing bank or group | Fees (US$m) | |
| 1 | Mizuho | 700.34 |
| 2 | Morgan Stanley | 592.96 |
| 3 | Sumitomo Mitsui | 523.65 |
| 4 | Nomura | 423.05 |
| 5 | JP Morgan | 419.72 |
| 6 | UBS | 407.45 |
| 7 | Goldman Sachs | 398.97 |
| 8 | Credit Suisse | 330.46 |
| 9 | Citigroup | 325.38 |
| 10 | Deutsche Bank | 315.99 |
| 11 | HSBC | 289.85 |
| 12 | Mitsubishi UFJ | 251.02 |
| 13 | BofA Merrill | 246.48 |
| 14 | Barclays | 229.16 |
| 15 | RBS | 87.44 |
| 16 | BNP Paribas | 60.31 |
| 17 | RBC | 51.73 |
| 18 | Lazard | 39.49 |
| 19 | Societe Generale | 24.46 |
| 20 | TD Securities | 22.45 |
| Top 20 Total | 5,740.36 | |
| Regional total | 11,044.03 | |
| Source: Thomson Reuters Deals Business Intelligence | ||
| Global Fees – DCM Bookrunners: 1/1/2012 to 28/10/2012 | ||
|---|---|---|
| Managing bank or group | Fees (US$m) | |
| 1 | JP Morgan | 1,623.80 |
| 2 | BofA Merrill | 1,323.57 |
| 3 | Citigroup | 1,243.43 |
| 4 | Deutsche Bank | 1,083.93 |
| 5 | Morgan Stanley | 1,015.52 |
| 6 | Barclays | 950.99 |
| 7 | Goldman Sachs | 923.07 |
| 8 | Credit Suisse | 864.5 |
| 9 | Wells Fargo | 696.52 |
| 10 | UBS | 670.13 |
| 11 | HSBC | 634.06 |
| 12 | RBS | 549.97 |
| 13 | RBC | 521.97 |
| 14 | BNP Paribas | 443.8 |
| 15 | Mizuho | 270.89 |
| 16 | Credit Agricole CIB | 217.94 |
| 17 | Nomura | 200.15 |
| 18 | TD Securities | 196.6 |
| 19 | Societe Generale | 185.69 |
| 20 | Scotiabank | 180.7 |
| Top 20 Total | 13,797.25 | |
| Industry total | 18,458.70 | |
| Source: Thomson Reuters Deals Business Intelligence | ||
| Global Fees – ECM Bookrunners: 1/1/2012 to 28/10/2012 | ||
|---|---|---|
| Managing bank or group | Fees (US$m) | |
| 1 | JP Morgan | 873.04 |
| 2 | BofA Merrill | 850.1 |
| 3 | Morgan Stanley | 845.1 |
| 4 | Goldman Sachs | 702.63 |
| 5 | Citigroup | 616.33 |
| 6 | Deutsche Bank | 571.88 |
| 7 | Credit Suisse | 564.27 |
| 8 | UBS | 542.61 |
| 9 | Barclays | 457.79 |
| 10 | RBC | 355.02 |
| 11 | Wells Fargo | 272.32 |
| 12 | Nomura | 253.19 |
| 13 | Citic | 158.73 |
| 14 | HSBC | 145.67 |
| 15 | Guosen Securities | 141.94 |
| 16 | BMO | 138.62 |
| 17 | Sumitomo Mitsui | 134.38 |
| 18 | Raymond James | 131.62 |
| 19 | Jefferies | 124.62 |
| 20 | CIBC | 120.71 |
| Top 20 Total | 8,000.57 | |
| Industry total | 12,721.35 | |
| Source: Thomson Reuters Deals Business Intelligence | ||
| Global Fees – Loans Bookrunners: 1/1/2012 to 28/10/2012 | ||
|---|---|---|
| Managing bank or group | Fees (US$m) | |
| 1 | JP Morgan | 1,058.08 |
| 2 | BofA Merrill | 940.42 |
| 3 | Citigroup | 578.28 |
| 4 | Wells Fargo | 490.24 |
| 5 | Credit Suisse | 485.9 |
| 6 | Barclays | 471.75 |
| 7 | Mitsubishi UFJ | 442.35 |
| 8 | Mizuho | 417 |
| 9 | Deutsche Bank | 377.5 |
| 10 | Sumitomo Mitsui | 314.71 |
| 11 | RBC | 308.97 |
| 12 | Goldman Sachs | 306.14 |
| 13 | RBS | 271.54 |
| 14 | Morgan Stanley | 270.8 |
| 15 | BNP Paribas | 221.56 |
| 16 | HSBC | 217.68 |
| 17 | General Electric | 207.37 |
| 18 | UBS | 173.49 |
| 19 | SunTrust Banks | 163.59 |
| 20 | BMO | 154.6 |
| Top 20 Total | 7,871.94 | |
| Industry total | 11,688.10 | |
| Source: Thomson Reuters Deals Business Intelligence | ||
| Global Fees – M&A Bookrunners: 1/1/2012 to 28/10/2012 | ||
|---|---|---|
| Managing bank or group | Fees (US$m) | |
| 1 | Goldman Sachs | 1,293.78 |
| 2 | Morgan Stanley | 1,003.01 |
| 3 | JP Morgan | 947.12 |
| 4 | Credit Suisse | 811.19 |
| 5 | Barclays | 710.52 |
| 6 | BofA Merrill | 659.67 |
| 7 | Lazard | 601.57 |
| 8 | Deutsche Bank | 520.82 |
| 9 | Citigroup | 482.01 |
| 10 | UBS | 458.26 |
| 11 | Rothschild | 394.71 |
| 12 | RBC | 329.63 |
| 13 | Jefferies | 328.5 |
| 14 | Evercore Partners | 317.93 |
| 15 | Houlihan Lokey | 227.76 |
| 16 | Moelis | 201.26 |
| 17 | Nomura | 199.99 |
| 18 | BMO | 198.46 |
| 19 | Qatalyst Partners | 165.31 |
| 20 | Macquarie | 164.13 |
| Top 20 Total | 10,015.63 | |
| Industry total | 15,066.98 | |
| Source: Thomson Reuters Deals Business Intelligence | ||