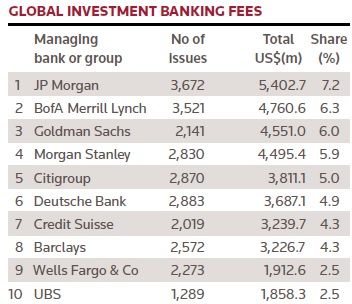
JP Morgan, Bank of America Merrill Lynch and Morgan Stanley each gained a little extra market share during October, eking out an additional 10bp of the pie as the end of the year draws closer.
The month was a good one for fees, with about 4,500 new issues during the month – more than 1,000 more than the average during the first nine months of the year – earning investment banks US$7.9bn, which was slightly down on what they earned in September.
That took the total earned from debt underwriting, equity underwriting, loans and advisory to US$75.6bn, some 9.3% higher than at the same point a year earlier. Underwriting activity has continued to be strong this year, and fees have been boosted by a resurgence in M&A.
Morgan Stanley has made the biggest leap so far this year, with its 5.95% market share some 41 basis points higher than at this stage last year. BofA Merrill and JP Morgan, which dominated fee earning last year, have seen the biggest falls in share, losing 65bp and 90bp respectively.
During October, UBS managed to climb a place to 10th, knocking Royal Bank of Canada off that spot. Mitsubishi UFJ Financial knocked BMO off the 19th spot in the only other change in the global fees table.
In bond underwriting fees, Deutsche Bank dropped from fourth to fifth, knocked off by Morgan Stanley. The bank reported a decline in debt underwriting fees in its third-quarter numbers to the end of September last week, and it looks as if that trend may have continued.
In loans, Credit Suisse dropped from fourth to sixth. There were no changes in the equities fees league table.
| Global investment banking fees | ||||
|---|---|---|---|---|
| Managing bank or group | No of issues | Total US$(m) | Share (%) | |
| 1 | JP Morgan | 3,672 | 5,402.70 | 7.2 |
| 2 | BofA Merrill Lynch | 3,521 | 4,760.60 | 6.3 |
| 3 | Goldman Sachs | 2,141 | 4,551.00 | 6 |
| 4 | Morgan Stanley | 2,830 | 4,495.40 | 5.9 |
| 5 | Citigroup | 2,870 | 3,811.10 | 5 |
| 6 | Deutsche Bank | 2,883 | 3,687.10 | 4.9 |
| 7 | Credit Suisse | 2,019 | 3,239.70 | 4.3 |
| 8 | Barclays | 2,572 | 3,226.70 | 4.3 |
| 9 | Wells Fargo & Co | 2,273 | 1,912.60 | 2.5 |
| 10 | UBS | 1,289 | 1,858.30 | 2.5 |
| 11 | RBC CM | 2,052 | 1,846.10 | 2.4 |
| 12 | HSBC | 2,915 | 1,526.20 | 2 |
| 13 | BNP Paribas | 1,925 | 1,373.20 | 1.8 |
| 14 | Jefferies LLC | 683 | 1,115.20 | 1.5 |
| 15 | Nomura | 1,389 | 1,055.60 | 1.4 |
| 16 | RBS | 1,631 | 908.6 | 1.2 |
| 17 | Mizuho Financial | 2,266 | 869.6 | 1.2 |
| 18 | Sumitomo Mitsui | 2,194 | 828.4 | 1.1 |
| 19 | Mitsubishi UFJ | 2,015 | 780.2 | 1 |
| 20 | BMO CM | 1,185 | 765.9 | 1 |
| | Total | 35,442 | 75,555.1 | |
| Americas investment banking | ||||
|---|---|---|---|---|
| Managing bank or group | No of issues | Total US$(m) | Share (%) | |
| 1 | JP Morgan | 2,518 | 3,626.80 | 8.8 |
| 2 | BofA Merrill Lynch | 2,559 | 3,523.60 | 8.6 |
| 3 | Goldman Sachs | 1,213 | 2,938.60 | 7.2 |
| 4 | Morgan Stanley | 1,441 | 2,786.60 | 6.8 |
| 5 | Citigroup | 1,659 | 2,410.20 | 5.9 |
| 6 | Barclays | 1,405 | 2,113.20 | 5.1 |
| 7 | Credit Suisse | 1,136 | 1,998.60 | 4.9 |
| 8 | Deutsche Bank | 1,407 | 1,930.50 | 4.7 |
| 9 | Wells Fargo & Co | 2,113 | 1,792.80 | 4.4 |
| 10 | RBC CM | 1,678 | 1,537.80 | 3.7 |
| | Total | 14,756 | 41,066.0 | |
| Global bonds | ||||
|---|---|---|---|---|
| Managing bank or group | No of issues | Total US$(m) | Share (%) | |
| 1 | JP Morgan | 1,641 | 1,559.10 | 7.8 |
| 2 | BofA Merrill Lynch | 1,559 | 1,303.10 | 6.5 |
| 3 | Citigroup | 1,554 | 1,278.50 | 6.4 |
| 4 | Morgan Stanley | 1,824 | 1,188.20 | 5.9 |
| 5 | Deutsche Bank | 1,736 | 1,152.70 | 5.7 |
| 6 | Goldman Sachs | 1,146 | 1,049.00 | 5.2 |
| 7 | Credit Suisse | 1,078 | 966.1 | 4.8 |
| 8 | Barclays | 1,428 | 944.5 | 4.7 |
| 9 | HSBC | 1,911 | 726.3 | 3.6 |
| 10 | Wells Fargo & Co | 1,021 | 684.3 | 3.4 |
| | Total | 16,265 | 20,097.3 | |
| Asia-pacific & Japan investment banking | ||||
|---|---|---|---|---|
| Managing bank or group | No of issues | Total US$(m) | Share (%) | |
| 1 | Morgan Stanley | 938 | 742.6 | 5.7 |
| 2 | Nomura | 883 | 650.1 | 5 |
| 3 | Mizuho Financial | 1,652 | 559.2 | 4.3 |
| 4 | Sumitomo Mitsui | 1,612 | 542.3 | 4.2 |
| 5 | Goldman Sachs | 452 | 517.7 | 4 |
| 6 | Citigroup | 494 | 429.4 | 3.3 |
| 7 | UBS | 288 | 422.5 | 3.3 |
| 8 | JP Morgan | 332 | 402.2 | 3.1 |
| 9 | BofA Merrill Lynch | 430 | 372.1 | 2.9 |
| 10 | Credit Suisse | 313 | 354.2 | 2.7 |
| | Total | 11,814 | 12,918.3 | |
| Global equities | ||||
|---|---|---|---|---|
| Managing bank or group | No of issues | Total US$(m) | Share (%) | |
| 1 | Morgan Stanley | 435 | 1,491.40 | 7.6 |
| 2 | Goldman Sachs | 349 | 1,308.20 | 6.7 |
| 3 | JP Morgan | 420 | 1,289.20 | 6.6 |
| 4 | BofA Merrill Lynch | 388 | 1,059.00 | 5.4 |
| 5 | Citigroup | 353 | 984.5 | 5 |
| 6 | Deutsche Bank | 311 | 922.3 | 4.7 |
| 7 | Credit Suisse | 339 | 855 | 4.4 |
| 8 | UBS | 299 | 728.8 | 3.7 |
| 9 | Barclays | 283 | 688 | 3.5 |
| 10 | RBC CM | 352 | 472.3 | 2.4 |
| | Total | 4,718 | 19,548.9 | |
| EMEA investment banking | ||||
|---|---|---|---|---|
| Managing bank or group | No of issues | Total US$(m) | Share (%) | |
| 1 | Deutsche Bank | 1,018 | 1,403.30 | 6.5 |
| 2 | JP Morgan | 857 | 1,373.60 | 6.4 |
| 3 | Goldman Sachs | 511 | 1,094.70 | 5.1 |
| 4 | Citigroup | 742 | 971.5 | 4.5 |
| 5 | Morgan Stanley | 482 | 966.2 | 4.5 |
| 6 | Barclays | 866 | 949.2 | 4.4 |
| 7 | Credit Suisse | 594 | 886.8 | 4.1 |
| 8 | BNP Paribas | 1,043 | 881.3 | 4.1 |
| 9 | BofA Merrill Lynch | 560 | 864.9 | 4 |
| 10 | HSBC | 1,046 | 781.9 | 3.6 |
| | Total | 9,369 | 21,570.8 | |
| Global loans | ||||
|---|---|---|---|---|
| Managing bank or group | No of issues | Total US$(m) | Share (%) | |
| 1 | BofA Merrill Lynch | 1,388 | 1,442.90 | 8.3 |
| 2 | JP Morgan | 1,388 | 1,279.70 | 7.3 |
| 3 | Deutsche Bank | 682 | 982.2 | 5.6 |
| 4 | Barclays | 682 | 748.4 | 4.3 |
| 5 | Citigroup | 773 | 733.6 | 4.2 |
| 6 | Credit Suisse | 429 | 724.4 | 4.2 |
| 7 | Wells Fargo & Co | 995 | 673.8 | 3.9 |
| 8 | Goldman Sachs | 354 | 634.7 | 3.6 |
| 9 | Morgan Stanley | 331 | 590 | 3.4 |
| 10 | Mitsubishi UFJ | 1,365 | 528.9 | 3 |
| | Total | 8,461 | 17,419.5 | |