Many of Sub-Saharan Africa’s equity markets are small – with the Seychelles Securities Exchange only opening in August with a single listing – but the returns have been big, for those able to access them. But beware the investor nervous about volatility.
To see the digital version of this report, please click here.
To purchase printed copies or a PDF of this report, please email gloria.balbastro@thomsonreuters.com.
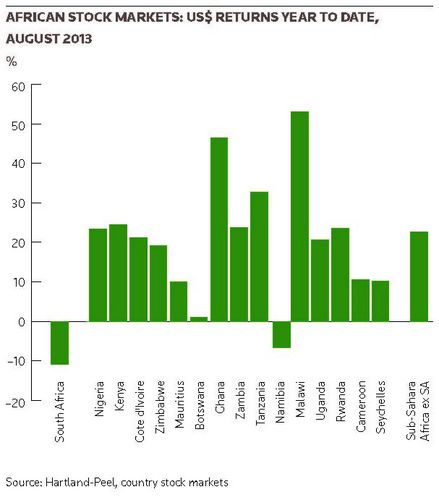
Sub-Saharan Africa, ex South Africa, markets fell back in August, led by Zimbabwe (down 22% following the latest election victory for President Mugabe) and Nigeria (down 6.1%).
Smaller markets have continued their rises such as Malawi up 25% on the month, but on low volumes. In the year to the end of August, Malawi and Ghana have been outstanding with rises of 53% and 47% respectively. Nigeria and Kenya year to date are up 23% and 24%, respectively, and Zimbabwe – even factoring in the post-election correction – is up 21%.
August also marked the arrival of a new exchange as Seychelles opened for business with the listing of SACOS Insurance.
As ever, currency movements have significantly impacted US dollar-based returns for the year, for the positive in Uganda but adversely in South Africa, Nigeria, Botswana, Ghana, Zambia and Tanzania. The South African rand has slumped 17%, outpacing gains in the all share index, to leave dollar performance down 10.9%.
The graph sets out the 2013 US dollar returns for SSA and the individual markets. Excluding South Africa, for both reasons of scale and currency, Sub-Saharan Africa as a region has risen 23% in the first eight months of 2013. Despite the emerging and frontier markets sell-off, the performance to date is strong.
The market capitalisation of the Top 30 companies in August 2013 was down 5.8% on the month to US$79.5bn, but up 21% year to date and up 44% over the past twelve months.
Our analysis shows:
• Sixteen companies with a ROE above 25%
• Ten companies with a historic P/E below 10.0
• Eight companies with a dividend yield above 5%
• Seven companies with a price/book value below 1.5 times.
• ROE’s generally exceed the cost of capital and inflation. Higher ROE’s are rewarded with higher valuations
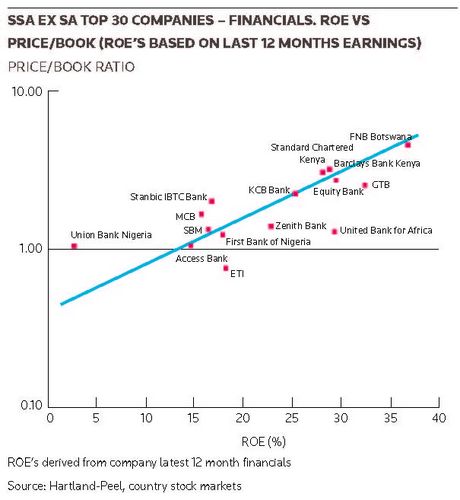
SSA ex SA Top 30: Banks
· Investors reward high ROE’s handsomely.
· From the graph, on a semi-log scale, there is strong correlation of ROE and Price/Book value.
· Following the EM and FM sell-off in Q2 2013 there is now greater divergence from the trend line, implying greater under-valuation.
· UBA, Zenith Bank, GTB and ETI look undervalued.
· Stanbic IBTC, Union Bank and MCB look overvalued.
This, we believe, has important implications for banks. Specifically, a higher ROE generates more capital for the bank to grow without recourse to shareholders, ie dilution, as well as enabling higher dividends to be paid.
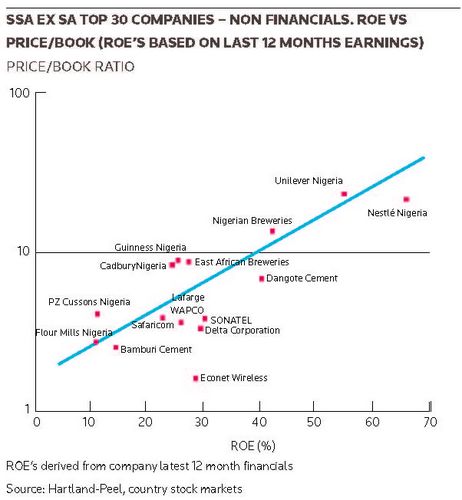
SSA ex SA Top 30: Industrial & Commercial Companies
· As with banks, investors reward high ROE’s handsomely.
· From the graph, on a semi-log scale, there is strong correlation of ROE and Price/Book value.
· Following the EM and FM sell-off there is now greater divergence from the trend line, implying greater under-valuation.
· Dangote Cement, SONATEL, Lafarge WAPCO, Delta Corp and Econet Wireless appear under-valued.
· PZ Cussons Nigeria, Cadbury Nigeria, Guinness Nigeria and East African Breweries look overvalued.
| Sub-Sahara Africa stock markets: August 2013 | ||||||
|---|---|---|---|---|---|---|
| Market capitalisation (US$bn) | P/E Historic | P/E Forecast | Dividend yield (%) | Price/book | 2013 US$ returns (%) | |
| South Africa | 870.8 | 16.4 | 13 | 3.5 | 4.5 | –10.9 |
| Nigeria | 69 | 18.8 | 12 | 3.2 | 7.03 | 23.4 |
| Kenya | 18.8 | 16.6 | 11 | 3.5 | 4.01 | 24.4 |
| Cote d'Ivoire | 7.1 | 14 | 8 | 7.5 | 3.68 | 21.2 |
| Zimbabwe | 5.1 | 12.6 | 10 | 1.6 | 2.73 | 19.2 |
| Mauritius | 5.2 | 10.3 | 11 | 2.8 | 1.59 | 10 |
| Botswana | 4.6 | 12.9 | 10 | 3.9 | 3.8 | 1.1 |
| Ghana | 4.4 | 22.2 | 12 | 2.5 | 7.73 | 46.5 |
| Zambia | 3.2 | 16 | 10.5 | 4.2 | 4.02 | 23.8 |
| Tanzania | 2.6 | 10.2 | 5.5 | 5.2 | 2.93 | 34.9 |
| Namibia | 1.4 | 9.4 | 6 | 6.9 | 2.69 | –6.6 |
| Malawi | 1.2 | 8.5 | 7.5 | 5.5 | 3.38 | 53 |
| Uganda | 1 | 14.7 | 13 | 4.6 | 3.18 | 20.6 |
| Rwanda | 0.9 | 20.4 | 10 | 2.9 | 11.94 | 23.5 |
| Cameroon | 0.3 | 12.8 | 4 | 3.4 | 4.02 | 10.5 |
| Seychelles | 0.1 | 8.3 | 7 | 8.6 | 1.04 | 10.2 |
| Sub-Sahara Africa ex SA | 124.9 | 17 | 11.1 | 3.5 | 5.64 | 22.6 |
| P/E < 10, dividend yield >5%, price/book < 1.5 | ||||||
| Source: Hartland-Peel, country stock markets, company annual and earnings reports | ||||||
| Top 20 companies, Sub-Sahara Africa ex South Africa | |||||||
|---|---|---|---|---|---|---|---|
| Country of listing | Share price | Market cap (US$m) | Historic P/E | Dividend yield (%) | Price/book | ROE, last 12 months (%) | |
| Dangote Cement | NIG | 190 | 19,821 | 17.2 | 1.6 | 6.9 | 40.2 |
| Nigerian Breweries | NIG | 165 | 7,639 | 31.7 | 1.8 | 13.35 | 42.1 |
| Nestle Nigeria | NIG | 935 | 4,537 | 33 | 2 | 21.68 | 65.7 |
| GTB | NIG | 24.53 | 4,420 | 8 | 6.3 | 2.56 | 32 |
| Zenith Bank | NIG | 19.71 | 3,788 | 6 | 8.1 | 1.35 | 22.5 |
| Sonatel | BRVM | 18,000 | 3,617 | 11.4 | 8.3 | 3.35 | 29.4 |
| Safaricom | KEN | 7.7 | 3,518 | 17.7 | 4 | 3.97 | 22.5 |
| First Bank of Nigeria | NIG | 16 | 3,196 | 6.8 | 6.3 | 1.2 | 17.5 |
| East African Breweries | KEN | 284 | 2,565 | 32.2 | 1.9 | 8.78 | 27.3 |
| Guinness Nigeria | NIG | 255 | 2,302 | 37 | 3.10% | 9.32 | 25.2 |
| Lafarge Wapco | NIG | 93 | 1,709 | 13.6 | 1.3 | 3.52 | 25.8 |
| MCB | MAU | 193.5 | 1,566 | 11.2 | 3 | 1.72 | 15.4 |
| ETI | NIG | 14.64 | 1,543 | 4.3 | 4.5 | 0.77 | 17.9 |
| Access Bank | NIG | 10.8 | 1,513 | 7.4 | 7.9 | 1.06 | 14.3 |
| United Bank of Africa | NIG | 7.33 | 1,451 | 4.3 | 6.8 | 1.25 | 28.9 |
| KCB Bank | KEN | 42 | 1,415 | 9.3 | 4.5 | 2.32 | 25 |
| Equity Bank | KEN | 32.75 | 1,385 | 9.7 | 3.8 | 2.83 | 29.1 |
| Unilever Nigeria | NIG | 57.7 | 1,336 | 39.7 | 2.4 | 21.74 | 54.8 |
| Delta Corporation | ZIM | 1.1 | 1,327 | 13 | 3.1 | 3.9 | 30.1 |
| Flour Mills Nigeria | NIG | 83.78 | 1,197 | 28.2 | 1.9 | 2.42 | 8.6 |
| Source: Hartland-Peel, country stock markets, company annual and earnings reports | |||||||